 The Distilled
Four models, one way of reading price.
Each model is a set of rules you can check candle by candle. The indicators draw them exactly as written, dashed while pending and solid once confirmed.
Sweep
A level is taken and price closes back inside. The CISD confirms it, then structure breaks.
Inducement
The first pullback after the break is the obvious entry. SIRC waits for it to be taken.
Retest
Price returns to the gap the move left. The entry is the close back out of it.
Continuation
Target 2R, stop beyond the sweep. If the stop goes first, the setup is over.
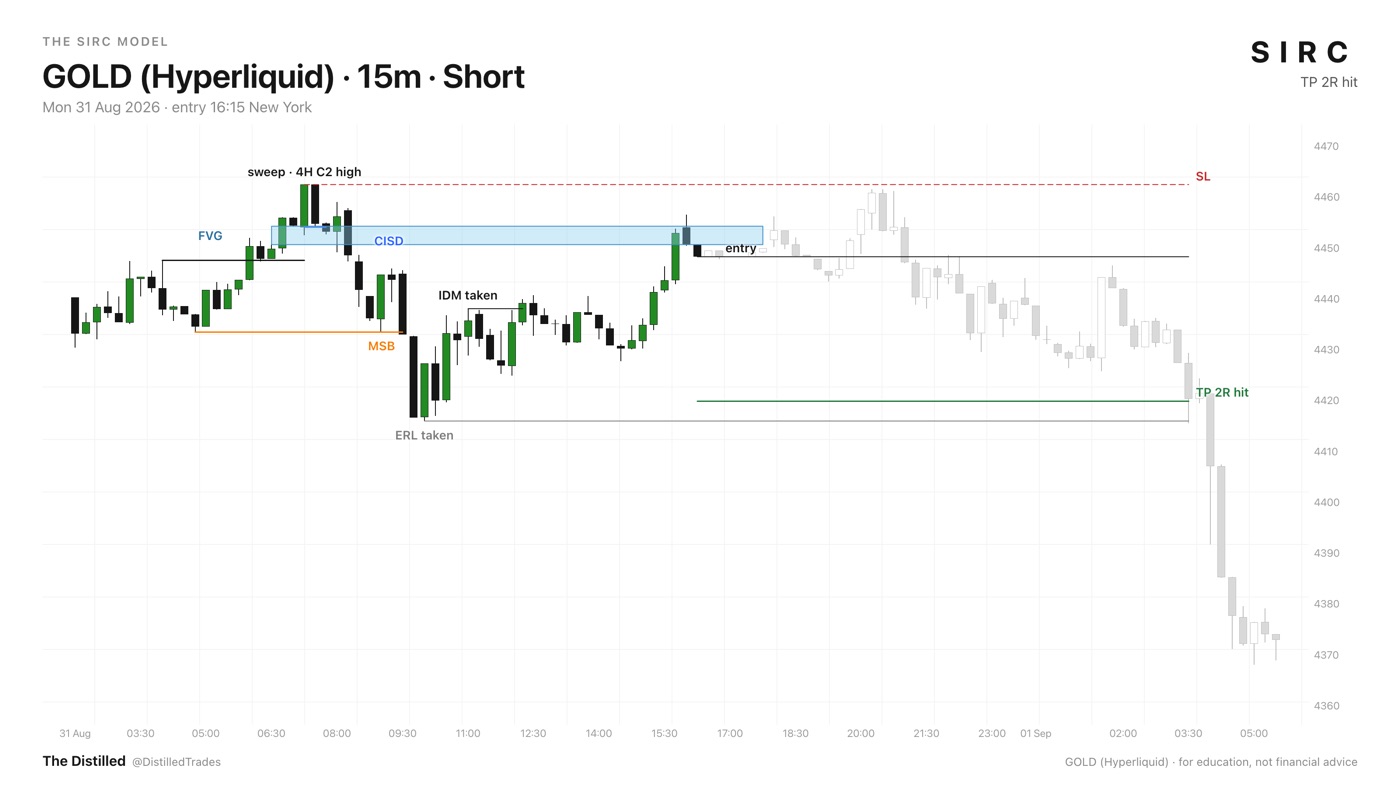
One example, chosen because it shows every stage; it reached 2R. Many setups stop out, and the SIRC guide includes one that did. In our five-year NQ test, SIRC setups reached their target about as often as chance predicts, which at 2R is roughly 1 in 3.
C2 and CISD
A higher-timeframe candle takes liquidity and closes back. The CISD confirms the shift on your timeframe.
Impulse IRL
The gaps an impulse leaves behind, where the leg ends, and which gaps are respected.
RCS 1-2-3
The reversal, the pullback and the break of the pullback, numbered on the chart.
Order flow
Each higher timeframe's gaps, their state and bias. Read it for context, not as a signal.