 The Distilled
Trade the retest, not the sweep.
The Distilled builds TradingView indicators and free education around one sequence: liquidity is swept, structure breaks, and price comes back to where the move began. Every chart we publish is real historical data, and we show losing trades too. Where a feed shows mostly winners, the post says so and gives the real hit rate.
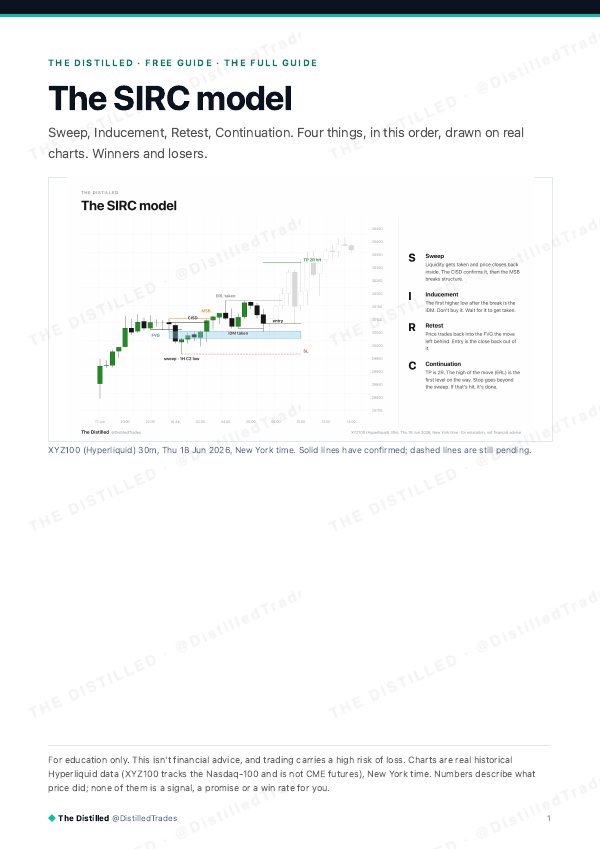
One example, chosen because it shows every stage; it reached 2R. Many setups stop out: in our five-year NQ test, SIRC setups reached their target about as often as chance predicts, which at 2R is roughly 1 in 3.
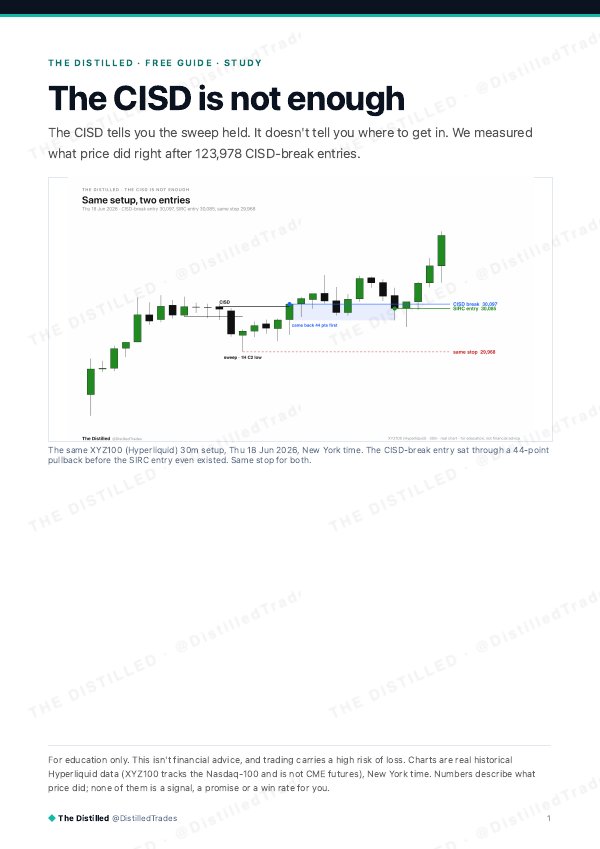
The CISD alone is a poor entry.
We measured every CISD-break entry on NQ, ES, gold and Bitcoin. Most of the time, price came back before it moved in the trade's favour. That pullback is where SIRC enters.
came back at least half-way to the stop before moving 1R.
came back at least a quarter of the way.
less risk, median, entering on the retest to the same stop.
These figures describe where price went after each entry, not how often either entry won: neither beat the chance line in our testing. Waiting for the retest also misses the trades where price never comes back. Method and limits.
The rules, drawn on your chart.
The Distilled Indicator
The full model on one chart: bias, draw on liquidity, the sweep, the CISD, the entry zone and the target.
Details →
Order Flow + Reversal Continuation Sequence
Six higher timeframes read at once: where a market turns (1-2-3) and where it keeps going, with the order-flow gaps behind it.
Details →
The Distilled Ladder
Which way, from where, to where: structure from swing points alone, with the continuation plan built on top.
Details →The Desk, the guides and the live feeds.
The Distilled Desk
A charting dashboard with periodically published session context, CISD, order flow, RCS and iFVG readings, weekly context and liquidity levels. Today also records model setups and simulated outcomes, including losses. These are not executed trades or verified trading returns. Updates depend on source availability and processing; check each view's timestamps.
- Sign in with your Whop account
- Built on Hyperliquid XYZ100 and GOLD data
- Works on your phone
The real Desk, blurred without Pro access. Built on XYZ100 and GOLD (Hyperliquid) data. Education only, not financial advice.
 Core and Pro
 Core and Pro
 Pro
 Pro

Start with the code.
Time Based Ranges and our open-source charting tools. Free to use, with source you can inspect.