 The Distilled
Journal, practice and honest testing
Logging every setup you see, practising on charts with the right-hand side covered, and judging results against the chance line, a placebo and costs.
Log every setup, not every trade
A journal of only the trades you took shows you the setups you liked. A journal of every setup shows you the model. So log everything you see, including the ones you skip: the date, market and timeframe, which of the S, I, R and C stages printed, whether you took it, the entry, the stop, the target in R and the result in R.
Write the reason and the target before the outcome. Afterwards, memory rewrites the reason, reliably and in your favour. The target in R fixes your chance line before you know how the trade went: 1 in 3 at 2R.
Skipped setups are how you find out whether your filters help. If you skip the untidy ones, the log will tell you whether the untidy ones actually did worse. Without them, you will never know.
Practise on covered charts
The reading has to be automatic before it is worth anything, and it becomes automatic through repetition on charts with nothing drawn on them. Scroll back a few weeks, cover everything to the right of one candle, and step forward one candle at a time, saying the read before you uncover the next: taken, reclaimed, CISD, MSB, IDM, tapped, closed back out.
Compress each read into one sentence, such as ‘Long, and a trade back through 25,193.25 says otherwise.’ If it will not compress, write ‘no read’ and move on. A chart you have to argue into shape is one you are supplying rather than reading.
Go back to the setups that failed and ask what you could have noticed at the time. Some will have had nothing to notice. Those teach you what a good loss looks like.
The chance line comes first
A win rate means nothing on its own. With a stop 1R away and a target k R away, a market with no edge hits the target about 1 in (1 + k) times: 50% at 1R, 40% at 1.5R, 33.3% at 2R and 25% at 3R. So ‘40% at 2R’ is above chance, and ‘60% at 1R’ is only 10 points above it. Always put the chance line next to the hit rate.
Then take costs off. Commission and spread cost more R on a tight stop, so a model that beats chance by two points can still lose money once costs are paid. The fairest test of all is a placebo: random entries with the same stop size, on the same market at the same time of day, run through the same target. If your rules do not beat that, they are not adding anything.
Four ways a test lies
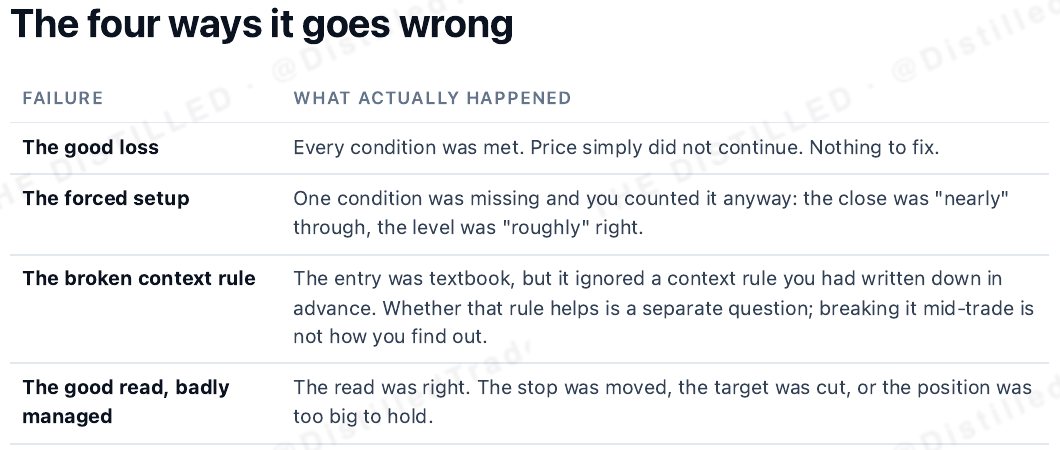
Looking ahead: using a candle's close before it closed, or a higher-timeframe level before that candle finished. Always ask whether you could have known it at the time. Picking examples afterwards: every reversal contains a sweep and a CISD, so every chart you pick later seems to confirm the model; count the failures too. Testing many ideas and keeping the best: try forty filters and one will look good by luck, so find the rule on one part of your data and check it once on another. Too few trades: twenty tells you almost nothing, while hundreds across markets and years start to.
We hold our own work to this. Most of the popular rules we have tested, including our own, land on their chance line: they describe the chart well but do not predict it. That is why this course teaches SIRC as a way to read price and place a defined risk, and never quotes a win rate without its chance line.
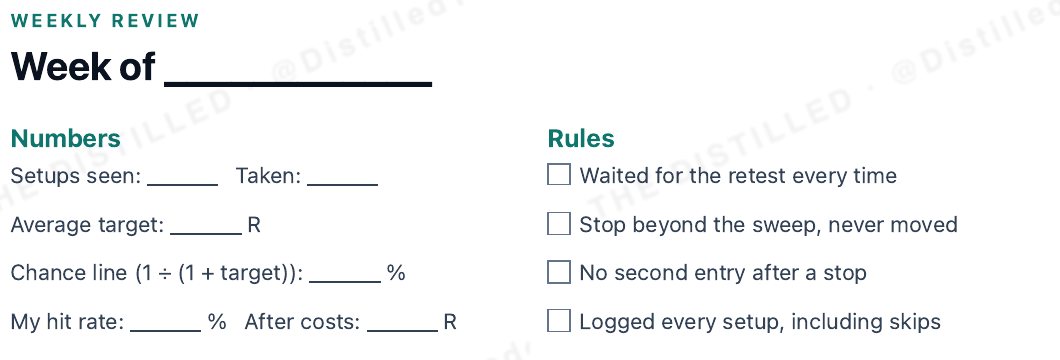
Once a week, fill in a review: setups seen and taken, the average target and its chance line, your hit rate before and after costs, and whether you kept the four rules. Waited for the retest every time. Stop beyond the sweep, never moved. No second entry after a stop. Every setup logged, including the skips.
- Log every setup you see, including the skips, with the target in R written first.
- Practise with the right-hand side covered, and say the read before you uncover the next candle.
- Put the chance line, 1/(1+k), next to every hit rate, then take costs off.
- Test against a stop-matched placebo, on data you did not tune on.
- Twenty trades tell you almost nothing. Judge a model over hundreds.
Print the journal or copy its columns into a spreadsheet. For the next two weeks, log every SIRC setup you see on one market and one timeframe pair, taken or not, with the target written before the outcome. At the end, work out your hit rate, the chance line for your average target, and your result in R after costs.
Related on the site
Education only, not financial advice.