 The Distilled
Risk
The stop defines the trade and the size follows from it. Thinking in R, working out a position size, costs, and why a run of losses at 1 in 3 is normal.
The stop comes first
A trade has two prices before it has a size: where you get in, and where you are wrong. Everything else, from how many contracts to how much of the account is exposed, is arithmetic that follows from those two numbers. In SIRC the entry is the close back out of the gap and the stop is beyond the sweep's wick. Both come from the chart.
The common mistake runs the other way: decide the size first, then look for somewhere to put the stop that keeps the loss comfortable. Price knows nothing about your account. A stop placed at whatever distance your balance can absorb gets traded through at the ordinary pace of a normal session, and you are taken out of a trade whose idea was still intact.
Think in R
One R is the distance from your entry to your stop, expressed in money: whatever you decided to risk on that trade. A trade that reaches twice that distance is +2R, and one that hits the stop is −1R. Thinking in R makes trades comparable across markets and account sizes, and it takes the currency figure, where most of the pressure lives, out of the decision.
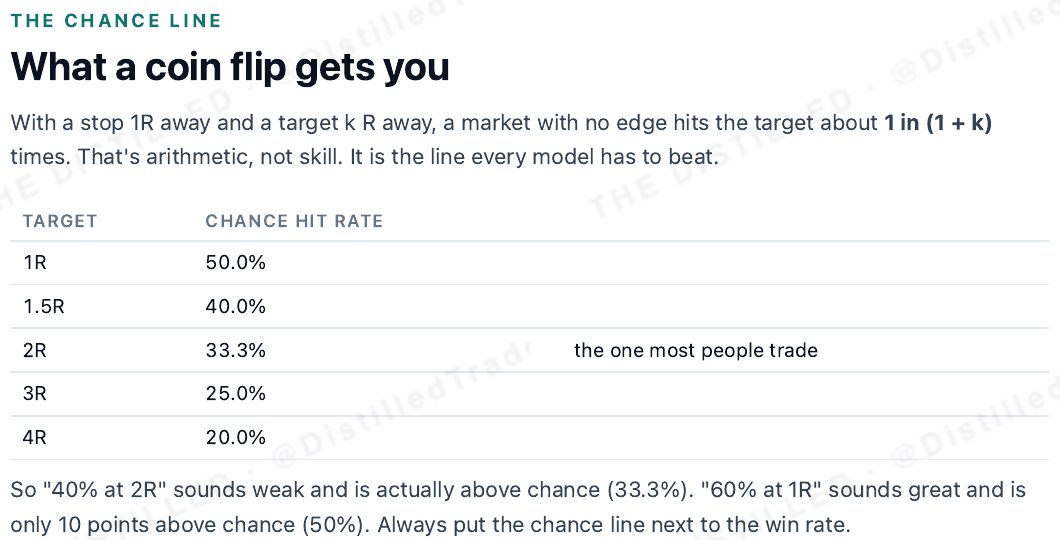
R also gives you break-even. With a 2R target, one win pays for two losses: one win of 2R minus two losses of 1R is zero. So a hit rate of one in three is break-even before costs, and one in three is also what chance gives at 2R. That is why a model that ‘wins a third of the time’ at 2R has, on its own, shown nothing yet.
Working out the size
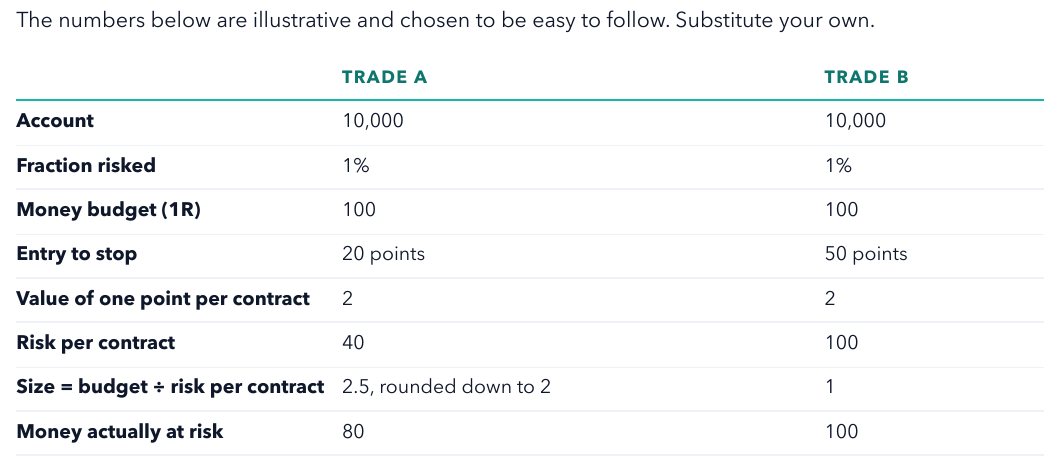
The sequence is always the same. Take your account size. Choose the fraction you risk per trade and fix it, once, away from the chart. Multiply the two to get your budget: your 1R. Measure the distance from entry to stop in points and convert it to money per contract. Divide the budget by the risk per contract, and round down.
On the 18 June 2026 SIRC long, the entry was 30,085 and the stop 29,968: 117 points. Traded on MNQ at $2 a point, a stop that size is $234 of risk per contract. With a $50,000 account risking 0.5%, the budget is $250, and 250 ÷ 234 is 1.07, rounded down to 1 contract, $234 at risk. On full-size NQ at $20 a point, one contract risks $2,340, far over the budget. That trade is too large for that account on NQ, so you skip it or use the smaller contract. You do not stretch the fraction to make it fit.
Costs come out of the same budget. Commission and spread are charged in points, so they cost more R on a tight stop, and a stop-out usually costs a little more than a clean 1R. Assume that rather than being surprised by it.
Losing runs at 1 in 3
If each trade has a 1 in 3 chance of reaching 2R, the chance that the next five all lose is about 13%. Over 100 such trades, the longest losing run is typically nine or ten, and a run of at least eight happens about three times in four. None of that needs anything to be wrong. It is what a 1 in 3 process looks like.
So size for the run, not the trade. Ten losses in a row at 1% risk takes an account down about 10%. At 2% it is about 18%. At 5% it is about 40%, and every trade after that is taken by someone under pressure. Pick a fraction that makes a normal losing run survivable and dull.
Then keep it fixed. Sizing up on the trades that feel strong means your largest positions land, sooner or later, on your least reliable reads. Never widen a stop, and never re-enter to win a loss back.
- Entry and stop come from the chart. Size comes from them.
- 1R is the money you lose if the stop is hit. At 2R, one win in three is break-even before costs.
- Size is the budget divided by the risk per contract, rounded down. If one contract is too big, skip it.
- At 1 in 3, a run of eight or more losses in 100 trades is normal.
- Fix the fraction. Never widen a stop, and never re-enter to win it back.
Open the position size calculator and enter your account, the fraction you intend to risk, and the entry and stop from your last five trades. Write down the size it gives for each and compare it with the size you actually traded. Then work out what ten losses in a row would do to your account at that fraction.
Related on the site
Education only, not financial advice.