 The Distilled
Inducement (IDM)
The first pullback after a break is the obvious entry. Why SIRC treats it as liquidity, how to mark it, and how to tell when it has been taken.
The obvious entry
After a sweep and a break of structure, price usually makes a new high (on a long) and pulls back. The first higher low that forms is where most people buy. It is obvious: the direction has just changed, there is a fresh low to put a stop under, and the risk looks small. That first higher low is the inducement, or IDM. On a short it is the first lower high.
The stops under that obvious higher low are liquidity too, for the same reason as any other obvious low: everyone who bought it has their stop in the same place. Price often comes back for them before it continues, and the run that takes them carries price back into the gap the move left. That is the whole reason SIRC waits.
Marking the IDM
The IDM is the first higher low after the break, read from the swings on your timeframe. It has to be a real pullback: at least a quarter of the move from the sweep. A two-candle pause near the high is not an IDM.
The IDM can move. If price makes a newer high before the IDM is taken, the IDM moves up to the next higher low. That keeps it tied to the latest obvious entry, the one people are actually watching, rather than an old one.
If price breaks below the last low of the leg instead, the leg is failing. Stand aside. That is not an IDM being taken; it is the move you were reading coming apart.
On a short everything flips. After the break down, price makes a new low and pulls back up; the first lower high is the IDM, and the stops above it are what price often comes back for.
Taken means a wick through it
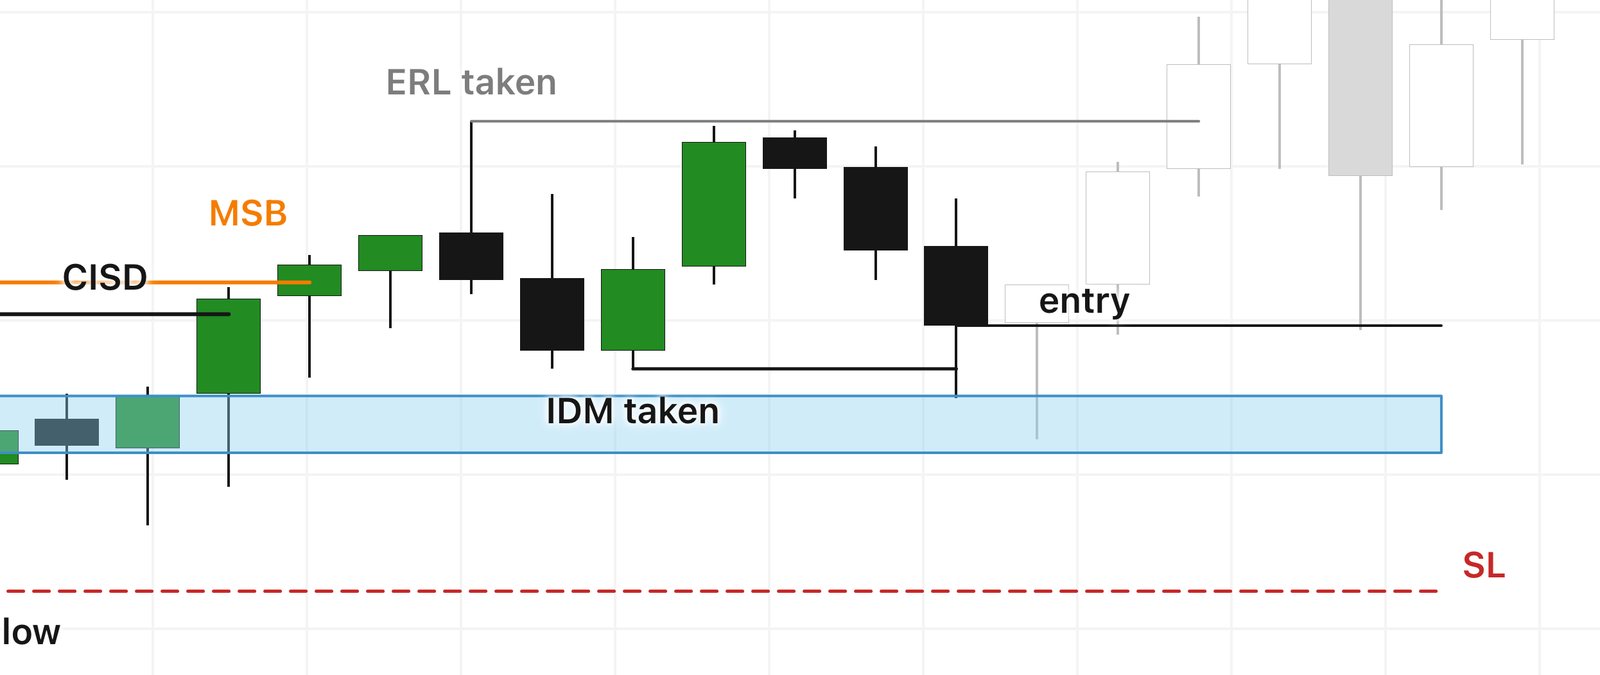
The IDM is taken when a wick trades through it. Unlike a break of structure, this does not need a close, because the point is the stops resting beyond it, and a wick is enough to fill them. On the SIRC charts the IDM line is dashed until it is taken and solid after.
Taken is not the entry. Once the IDM has gone, you are waiting for price to reach the gap beyond it and close back out, which is lesson 12. Sometimes price takes the IDM and keeps going, through the gap and through the sweep. That is what the stop is for.
Two examples
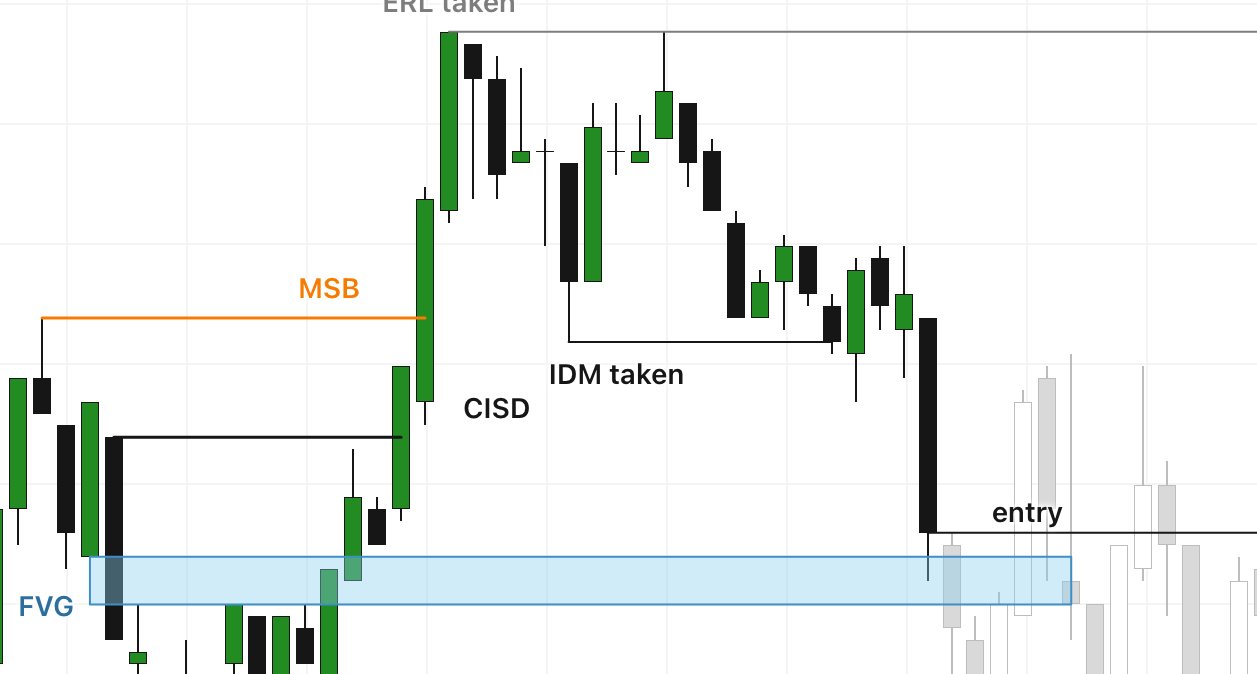
On the 18 June 2026 long (XYZ100, 30-minute candles), the move out of the sweep ran up to 04:00 New York and pulled back. The first higher low formed at 05:00, and the IDM line runs from it. Price chopped around for two hours, then the 07:00 candle fell through that low, taking the stops beneath it, reached the top of the FVG and closed back out of it, all in one bar.
On the 3-minute long from 16 September 2026, the pattern is the same at a smaller size. The IDM formed at 03:18. Price drifted down, the 03:51 candle took the IDM, and the 04:03 candle wicked into the gap and closed back out of it. On the 3-minute chart the entry came well below the obvious long. On the 30-minute chart the same candle took the IDM, tapped the gap and closed back above the IDM, so the entry was near where the obvious buyers got in; what had changed was that their stops had just been taken.
What waiting for the IDM buys you
Be precise about the claim. Waiting for the IDM to be taken does not make a trade more likely to reach its target. It changes where you get in. An entry after the IDM has gone sits closer to the stop than an entry on the obvious higher low or on the break, so the same stop means a smaller risk.
Sometimes price never takes the IDM, and the move leaves without you. That is a missed trade, not a loss, and it is the cost of the approach. What you gain is a different relationship with the obvious entry. Instead of buying where everyone else buys, you mark it and watch it. When it goes, you know the people who bought it have been stopped out, and you know where price is heading next: back into the gap.
- The IDM is the first higher low after the break (lower high on a short): the obvious entry.
- It must be a real pullback, at least a quarter of the move from the sweep.
- A newer high before it is taken moves the IDM to the next higher low.
- It is taken when a wick trades through it. Then you wait for the retest.
- Waiting changes where you enter and the size of the risk, not the odds.
Find five recent sweeps followed by a break of structure on your chart. On each, mark the first higher low (or lower high) that pulled back at least a quarter of the move. Note how many were taken by a wick before price went on, how many were never taken, and where price went straight after each one was taken.
Related on the site
Education only, not financial advice.