 The Distilled
Timeframes together
Location from the higher timeframe, timing from the lower one. How to pair two timeframes, read the higher one from closed candles only, and why agreement is context rather than a filter.
Two charts, two jobs
Most traders read one chart. This course reads two, and each has a job. The higher timeframe tells you where: which levels are in play, which liquidity sits nearby, which way the larger delivery has been running. The lower timeframe tells you when: it shows the sweep and the confirming close in enough detail to put a tight, specific stop behind them.
Each is weak on its own. Higher-timeframe candles take too long to close, and by the time one confirms, the move has often gone. A lower timeframe prints confirming closes in both directions all session, with nothing to tell you which ones matter.
Pick a pair and stay in it
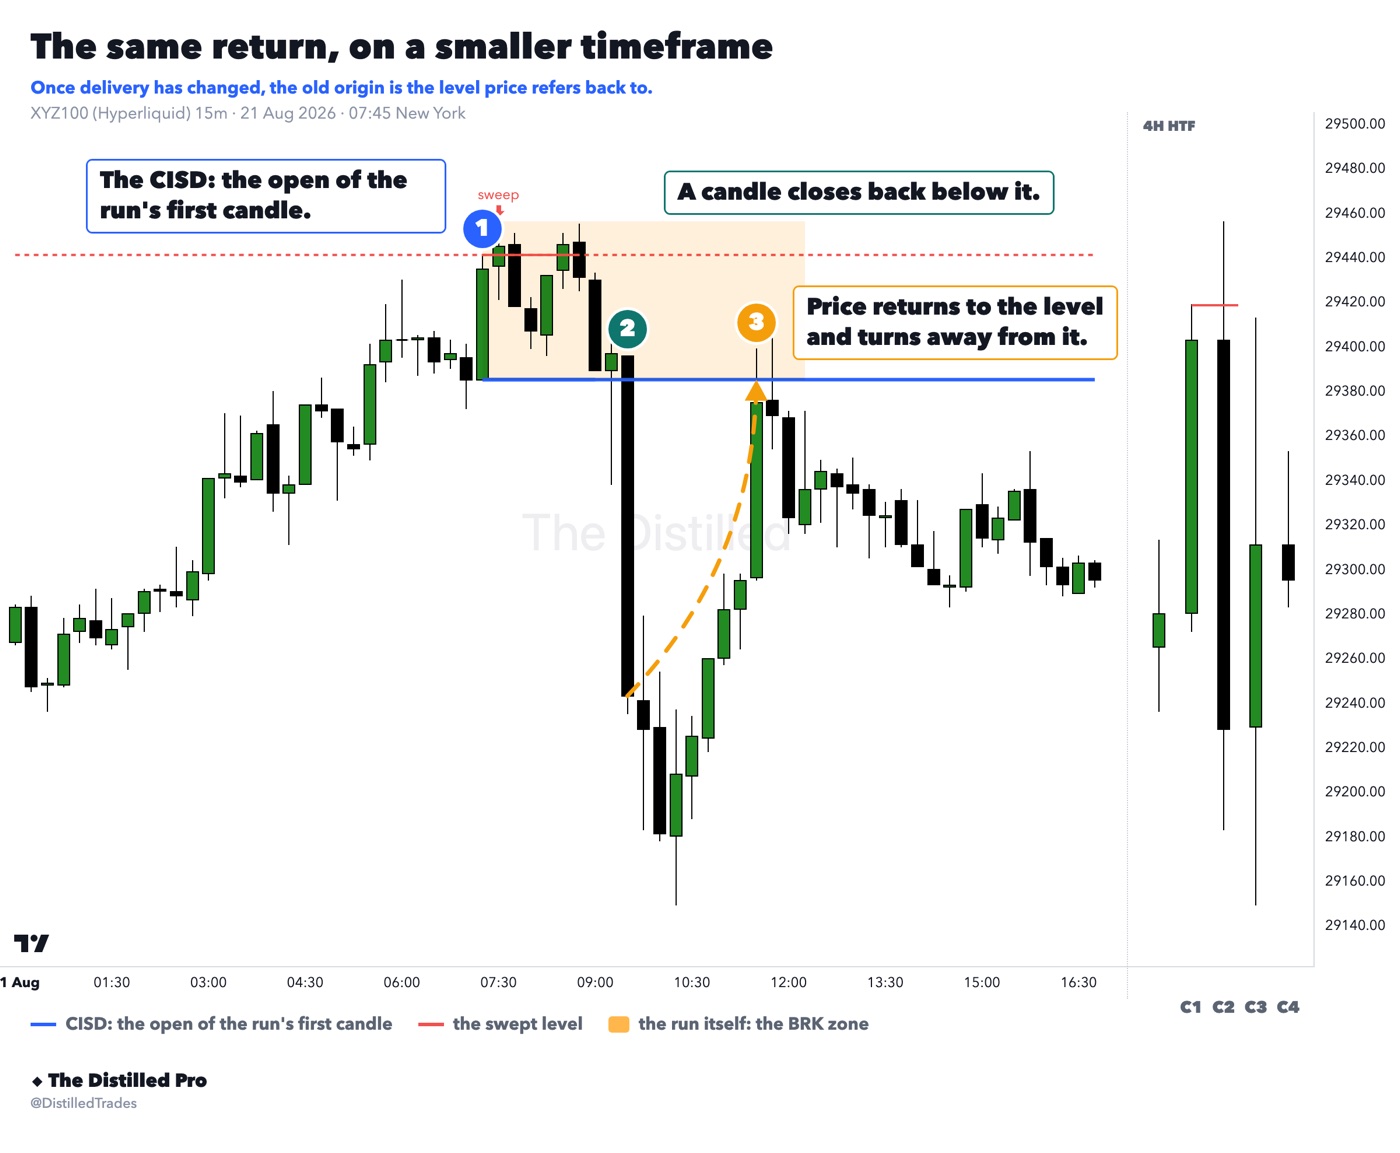
The usual pairings are 1 minute against 15 minutes, 5 minutes against 1 hour, 15 minutes against 4 hours, and 1 hour against the daily. Each step is roughly the same ratio. Choose by asking how long you are willing to be in a trade: minutes, a few hours, or days.
Keep the pair wide. If the higher timeframe is too close to the lower one, you are reading the same information twice at a slightly different resolution. It feels like confirmation and it is not.
Then stay in the pair for the whole trade. The common error is drifting: taking the idea from the 4-hour chart, timing it on the 15-minute, then managing it on the 1-minute because the 1-minute is moving. Now you are reading noise against a swing idea, and you will be shaken out of a trade that was still intact.
In practice, run the two charts side by side, the higher one on the left and the lower one on the right, with the symbol linked so changing one changes both. Mark the higher-timeframe levels on both charts before the session, so you are not switching back and forth to find them.
Only closed candles count
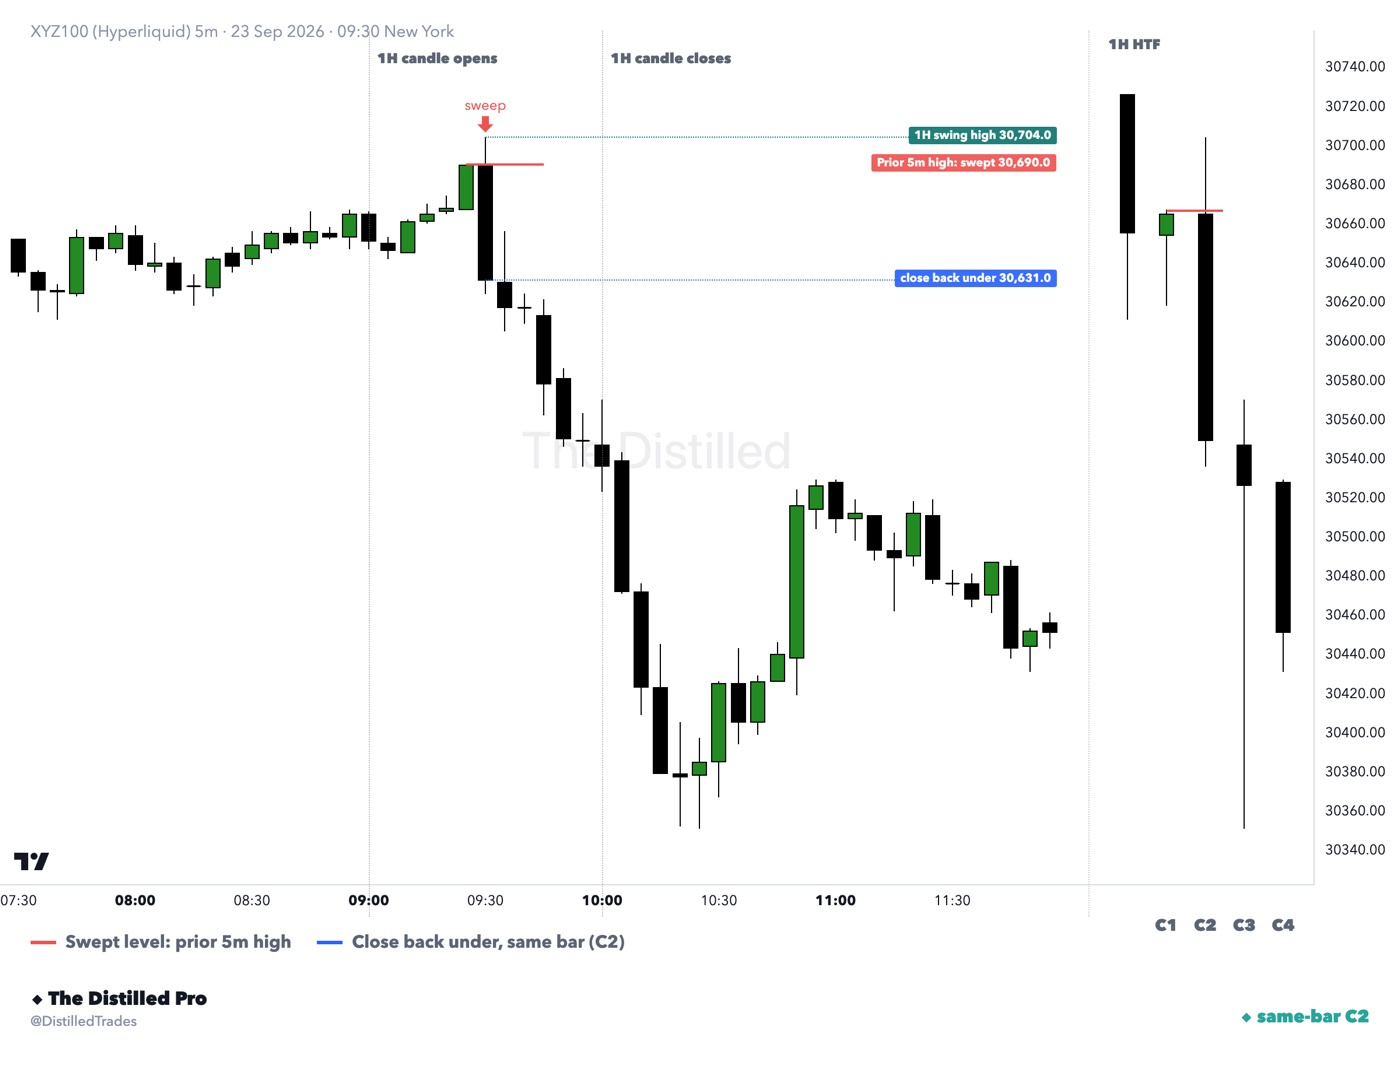
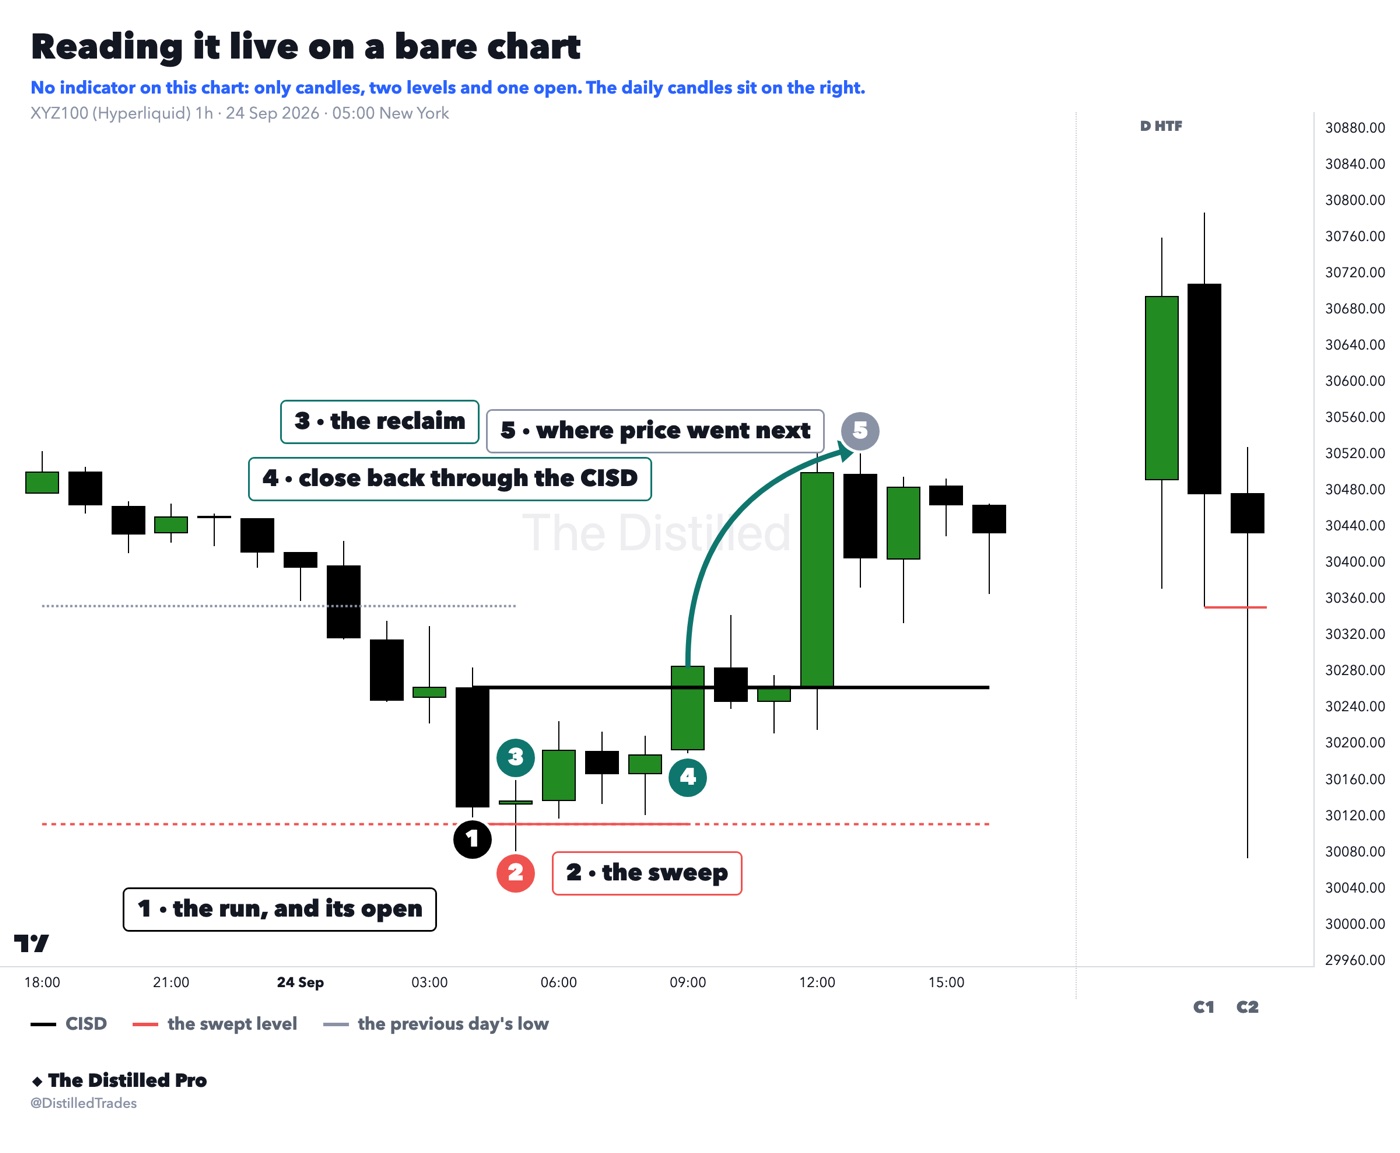
Read the higher timeframe from closed candles. A 1-hour candle that is still forming can look like a C2 at twenty past and like a breakout at ten to. Anything you concluded in between was noise. On the figures in this lesson, the panel on the right shows only higher-timeframe candles that had fully closed by the last candle on the chart, and C1 and C2 are labelled only where the pair really meets the definition.
The same care applies looking down a timeframe. Afterwards, the 5-minute bar that printed an hour's high very often looks like a C2. We counted 600,788 higher-timeframe C2 turns: 69.9% had a C2 on the bar that printed the extreme, against 51–59% at comparable extremes that were not C2 turns. Looking forward, that gap almost disappears. At a live 1-hour high, a 5-minute sweep and reclaim went on to become the hour's high 51–58% of the time, against 49–54% for ordinary pullbacks of the same depth. It is a clearer way to read what happened, not an early warning.
Agreement is context, not a filter
It is tempting to take only the trades where every timeframe points the same way. We tested it. On 150,008 setups, entries where all three trend reads agreed reached 2R 32.87% of the time, and entries where none agreed 32.60%. The chance line at 2R is 33.3%. With the order flow one timeframe up aligned with the trade, 66% of CISD-break entries still came back half-way to the stop before moving 1R; against it, 67%.
So use the higher timeframe to choose which area you are watching and which level would cancel the idea. Do not use agreement as a reason to expect the trade to work, and do not size up because the frames line up.
A habit that helps: before the session, write the higher-timeframe context in one sentence. Which level is in play, and what would cancel the idea. Then let the lower timeframe decide whether anything happens there. If nothing does, that is the answer for the day.
- The higher timeframe gives you location. The lower one gives you timing.
- Common pairs: 1m with 15m, 5m with 1h, 15m with 4h, 1h with the daily. Pick one and stay in it.
- Read the higher timeframe from closed candles only.
- Hindsight flatters the lower timeframe. Looking forward, the lift was 2 to 4 points.
- Agreement did not change the odds: 32.87% against 32.60% at 2R, with the chance line at 33.3%.
Choose one pair, for example 5 minutes against 1 hour, and set up two charts side by side. Before each session, write down the higher-timeframe levels in play and the last closed 1-hour candle's high and low. During the session, mark each lower-timeframe sweep and note whether it happened at one of those levels. Keep the list for two weeks before you draw any conclusion.
Related on the site
Education only, not financial advice.