 The Distilled
Reading the chart
Candles, wicks and closes, why the timeframe you pick changes what you see, and the New York clock the rest of this course runs on.
Four prices in every candle
A candle records four prices over a fixed slice of time: where price opened, the highest it traded, the lowest it traded, and where it closed when the time ran out. The body is the span between the open and the close. The wicks are the rest: ground price covered and then gave back.
On the charts in this course, a candle that closed higher than it opened is green and one that closed lower is black. Some charts show later candles in grey. Those came after the entry, and they are there so you can see what happened next without mistaking them for part of the read.
Two of the four prices do most of the work in this course. The high and the low mark the furthest price managed in each direction before it stopped, and traders leave orders just beyond them. The close is where the whole period finished. It is the only price in the candle that everyone had to accept; every other price inside it was only available for a moment.
A wick is an attempt, a close is a decision
Most of the mistakes this course tries to prevent come from reading a wick as if it were a close. While a candle is still open, its high, low and close are all still moving. A level that price has traded through halfway through the candle can be given back before the candle finishes, and often is.
So one rule runs through every lesson: nothing counts until the candle closes. A sweep needs a close back inside. A break needs a close beyond. A change in delivery needs a close through. If you cannot see the close yet, you do not have the event yet.
The one price that is fixed from the moment a candle starts is its open. Nothing that happens later inside the candle can change it. That is why one of the key levels later in the course, the CISD, is an open rather than a wick or a close.
A timeframe is a choice, not the truth
One hour of price can be drawn as a single 1-hour candle, four 15-minute candles or twelve 5-minute candles. None of these is the real one. A pattern that shows clearly on the hourly chart may be spread across several candles on the 5-minute chart, with no single pair of candles showing it at all.
That matters because every definition in this course is a statement about a particular timeframe. A 15-minute sweep and a 4-hour sweep are different events, even on the same afternoon. Pick the timeframe first, then read the chart on its own candles. Lesson 7 shows how to use two timeframes together without letting them blur into one.
The New York clock
Every session rule in this course is written on New York time. The NQ futures trading day runs from 18:00 to 17:00 New York, with a pause from 17:00 to 18:00. We split it into four sessions: Asia from 18:00 to 01:00, London from 01:00 to 08:00, New York from 08:00 to 15:00, and the PM session from 15:00 to 17:00.
New York and London change their clocks on different weekends, so for a few weeks a year the gap between them is four hours rather than five. If your chart uses a fixed UTC offset, every session box is an hour out for most of the year. Set the chart to New York time and the sessions line up on their own.
The sessions behave differently. Measured on 1,284 CME NQ days from 2021 to 2026, New York covered a median 84% of the day's full range, London 38%, the PM session 30% and Asia 28%. New York printed the day's high on 45% of days, against 24% for a random walk with the same volatility. That tells you when NQ tends to move. It does not tell you which way.
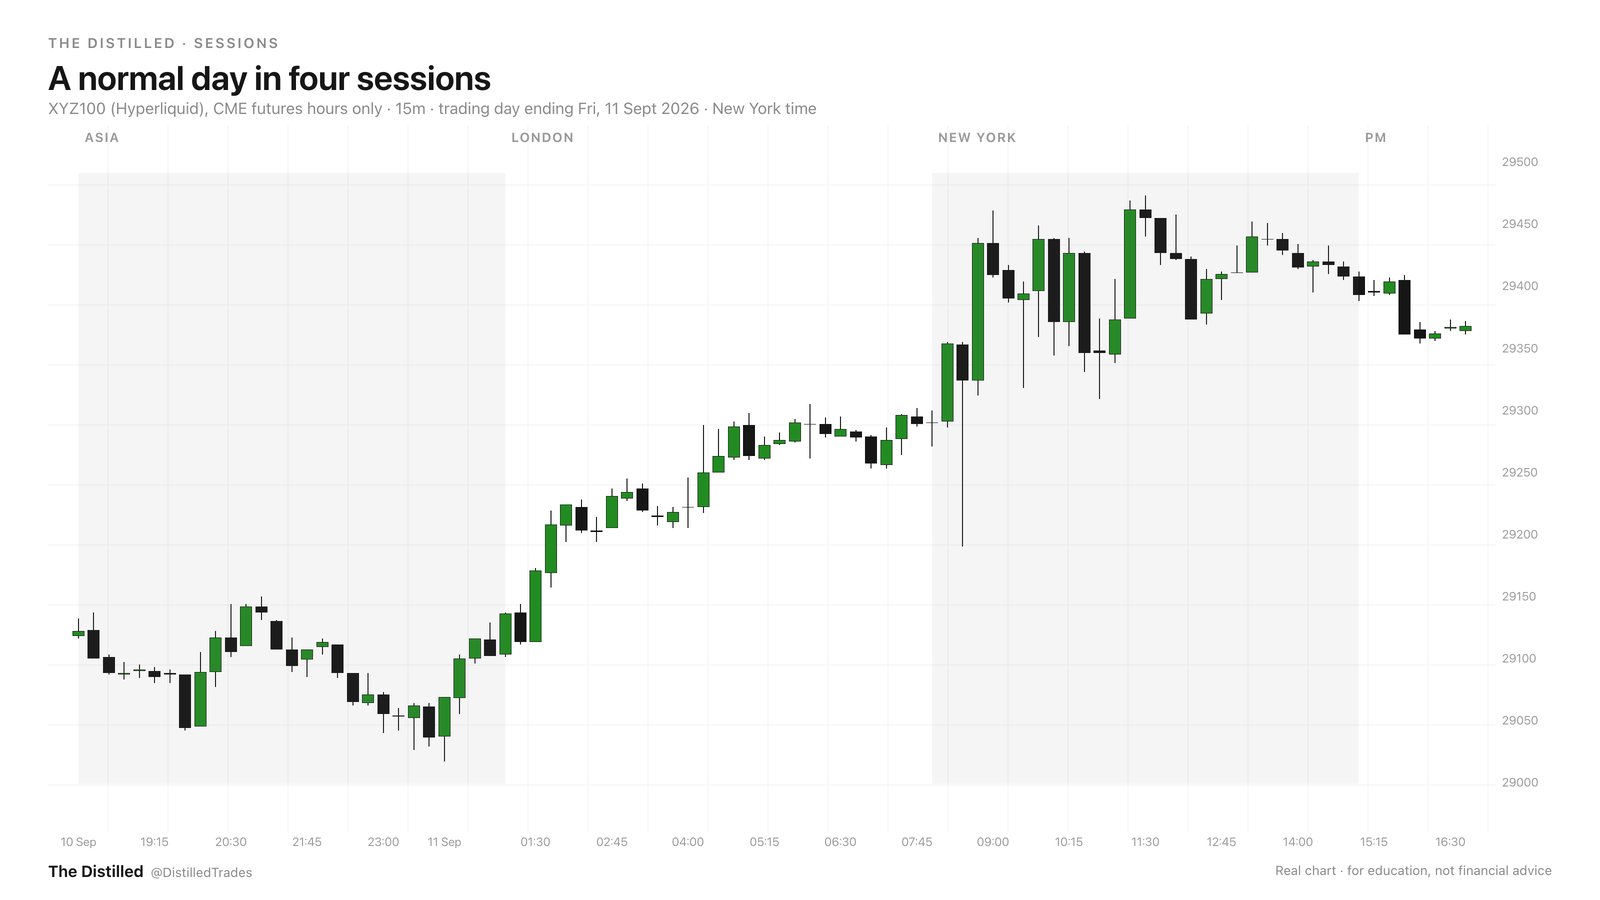
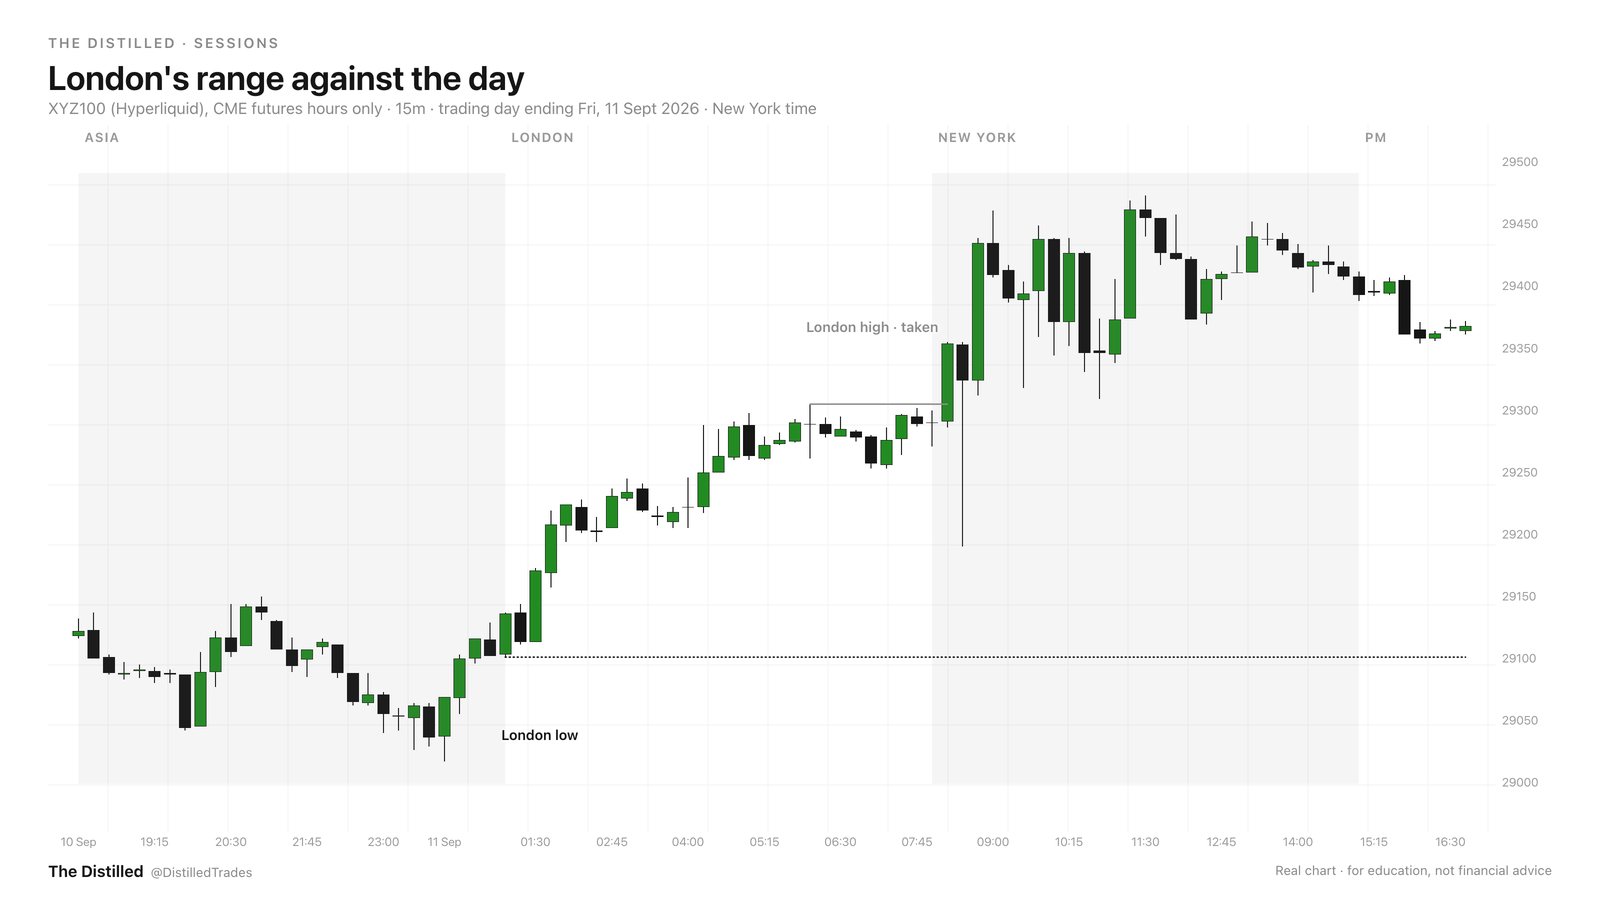
- A candle has four prices. The close is the only one everybody had to accept.
- A wick through a level is an attempt. Wait for the close before you call anything.
- Every pattern belongs to the timeframe you found it on.
- Use New York time: Asia 18:00, London 01:00, New York 08:00, PM 15:00.
- New York is where NQ usually moves most. That tells you when, not which way.
Set your chart to New York time. On NQ or the market you trade, mark the four sessions on your last ten trading days. For each day, write down which session printed the high and which printed the low, then compare your ten days with the 45% New York figure in this lesson.
Related on the site
Education only, not financial advice.