 The Distilled
Liquidity
Where resting orders sit on a chart, why price keeps reaching them, and why a level being taken is normal rather than a signal.
Stops sit where everyone can see them
When you buy, you decide where you will admit you were wrong and leave a stop there. Most people who are long put that stop just below the last obvious low, because that is the low that would prove them wrong. So underneath an obvious low sits a cluster of sell orders waiting to be triggered.
Above an obvious high it is the mirror image, with one extra ingredient. Shorts have their stops there, and breakout buyers have their entry orders there. Both are buy orders.
That cluster is what traders mean by liquidity. When price reaches it, the orders fill. Anyone who needs to buy or sell in size needs someone on the other side, and these clusters are where that business is waiting. No conspiracy is needed to explain why price trades to them: obvious levels collect resting orders, and resting orders are where size can be filled.
The levels to mark
You do not need hidden levels. The useful ones are the obvious ones, because obvious is what collects orders. Swing highs and lows on your timeframe. Equal highs and lows: two or more touches finishing at the same price. The high and low of each session: Asia, London and New York. The previous day's high and low (PDH and PDL) and the previous week's (PWH and PWL). And the high and low of the last higher-timeframe candle, such as the last 1-hour or 4-hour candle.
Draw each level from the candle that made it, not from the session open or a round number nearby. The level is that wick. On our charts a level is dotted while it is still resting and solid grey once price has traded through it. Next to every level that gets taken, write whether it was a sweep or a break; lesson 3 shows how to tell.
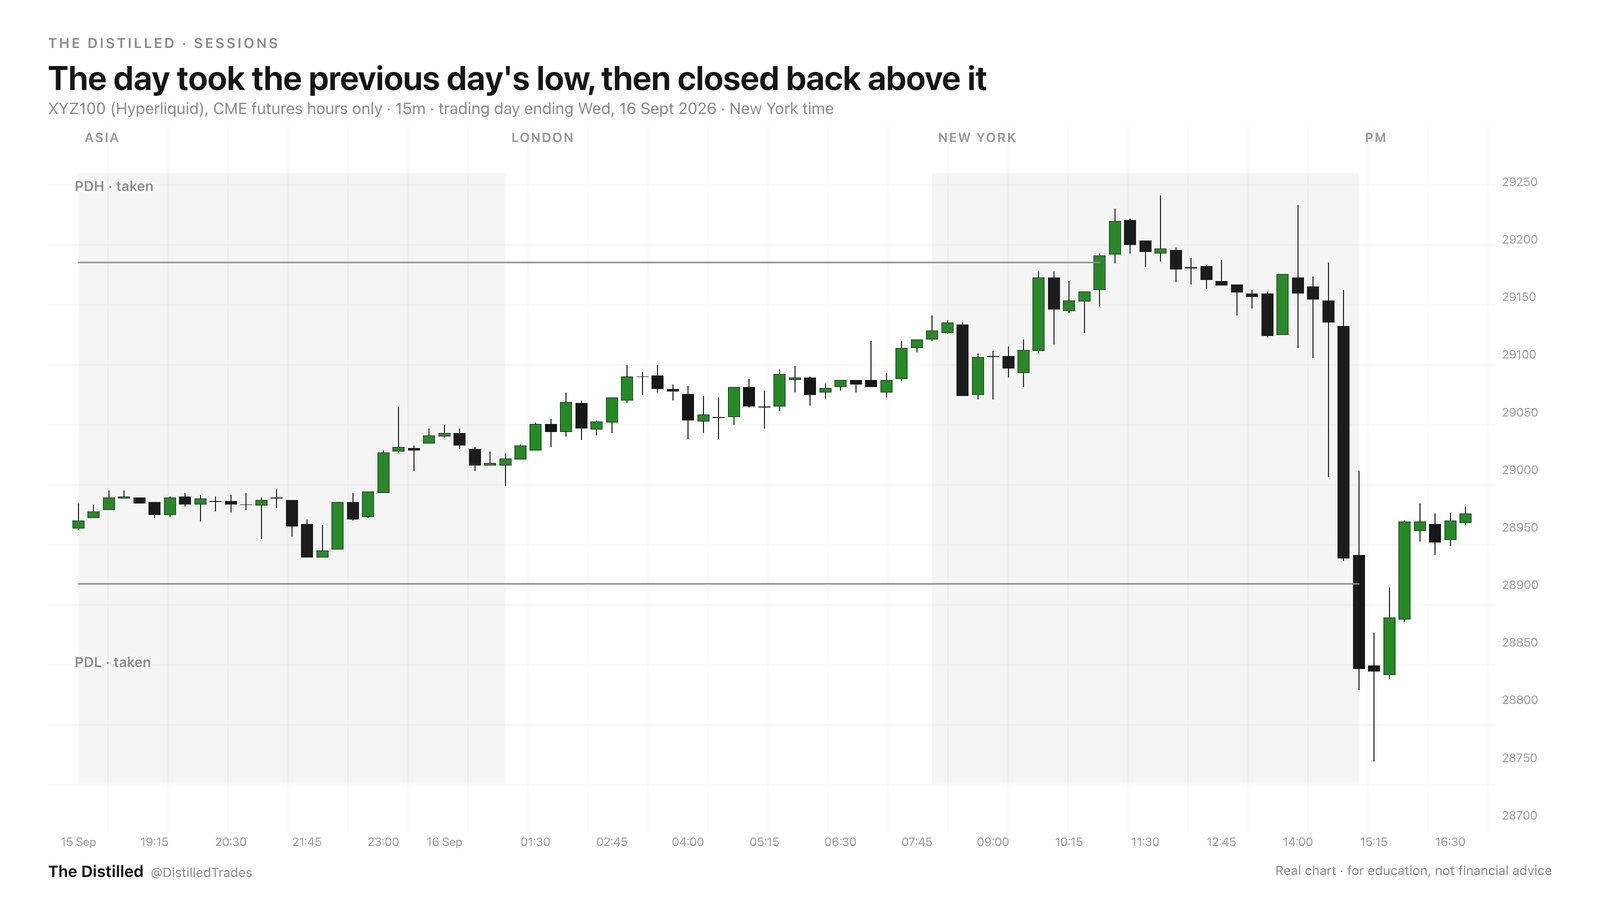
Being taken is the normal case
Here is the part most people skip. These levels get taken all the time. On 1,284 CME NQ days from 2021 to 2026, the day traded through the previous day's high or low on 89% of days, and through both on 12%. London traded through at least one side of Asia's range on 92.5% of CME NQ days, and on 91–94% of days across NQ, the S&P 500 and gold over five years.
Something that happens on nine days out of ten cannot, on its own, tell you much about the day. ‘Price took the previous day's low’ describes a normal day. What came next was close to a coin flip: after taking the previous day's low, the day closed back above it 53% of the time; after taking the previous day's high, it closed back below it 44% of the time.
So a level tells you where the orders probably are. It does not tell you whether price will get there, or what happens when it does. That is why every model in this course waits for more: a close back inside, a change in delivery, a break of structure.
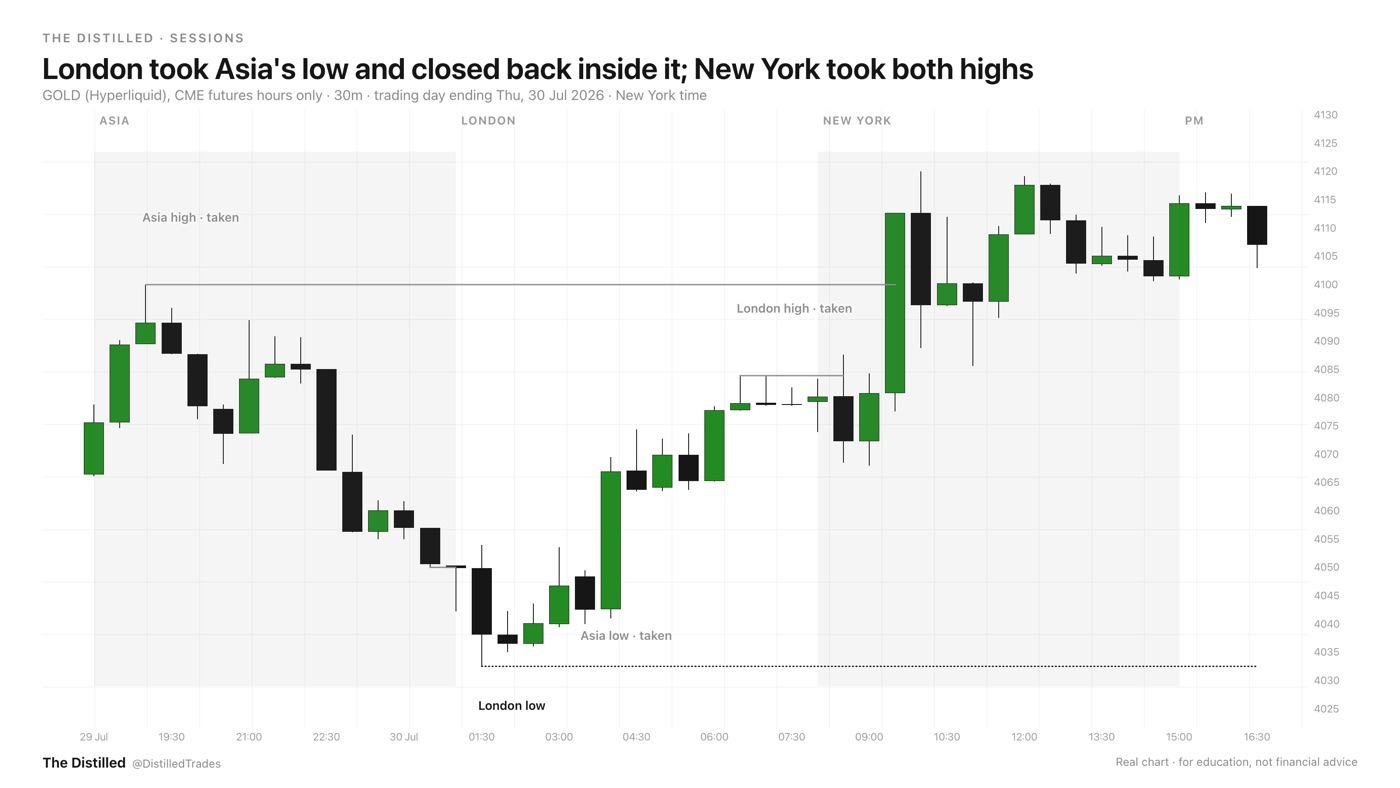
Distance, not the story, sets the odds
Traders often talk about price being drawn to liquidity, as if an untaken pool pulled harder than an ordinary level. We tested that on 38,952 NQ trades. The chance of reaching a target before the stop matched 1/(1+k), where k is the target's distance in multiples of the stop, at every distance from 0.28R to 17.45R, within 2.3 points. An untaken pool had no extra pull once you allowed for how far away it was.
So use liquidity to decide where to look and where to aim. Do not use it as a reason to expect price to get there. How often a level is reached is mostly a matter of how far away it is: about 50% at 1R, 33% at 2R and 17% at 5R.
- Liquidity is the cluster of stops and entry orders just beyond an obvious high or low.
- Mark swing, equal, session, previous-day and previous-week highs and lows, from the candle that made them.
- London took an Asia extreme on 91–94% of days. A level being taken is normal.
- How often a level is reached depends mostly on its distance: about 1/(1+k).
For the next ten trading days, mark the previous day's high and low before the session opens. Each day, note which one was taken first, and whether the candle that took it closed back inside or closed beyond and held. Do not trade it. Just get the reading right.
Related on the site
Education only, not financial advice.