 The Distilled
Market structure
Swing highs and lows, the difference between a break of structure and a market structure break, and why a break has to be a close.
Swings are the skeleton
Market structure is the sequence of swing highs and swing lows on your chart. A swing high is a candle whose high stands above the highs of the candles either side of it; a swing low is the mirror. A common definition asks for two candles on each side. The exact number matters less than using the same one every time.
A swing is only confirmed once those later candles have closed. That lag is not a flaw. It is the cost of knowing the high really was a high. Anything you mark before then is a candidate, and it should look like one on your chart: dashed, not solid.
In an up move, price makes higher highs and higher lows. In a down move, lower highs and lower lows. At this level that is all a trend is: a sequence of swings taken and not given back.
Two breaks that mean different things
A break of structure (BOS) is a close beyond a swing in the direction price was already going, such as a new high in an up move. It confirms what you already knew. A trend is made of them.
A market structure break (MSB) is a close through a swing against the direction price had been going: in a down move, a close above the last lower high. This is the one that is supposed to mean something changed, and the one traders read into far too early.
In SIRC the MSB has a precise job. After a sweep of a low, it is a close through the last swing high before the sweep. The sweep and the CISD tell you an attempt failed. The MSB tells you price has also taken back the structure that led into the sweep.
To find that swing, look left from the sweep and take the most recent confirmed swing high that formed before price reached the low. Not the highest high on the screen, and not a swing that formed after the sweep. If the nearest one is small, it still counts: the rule is the last swing, not the most impressive one.
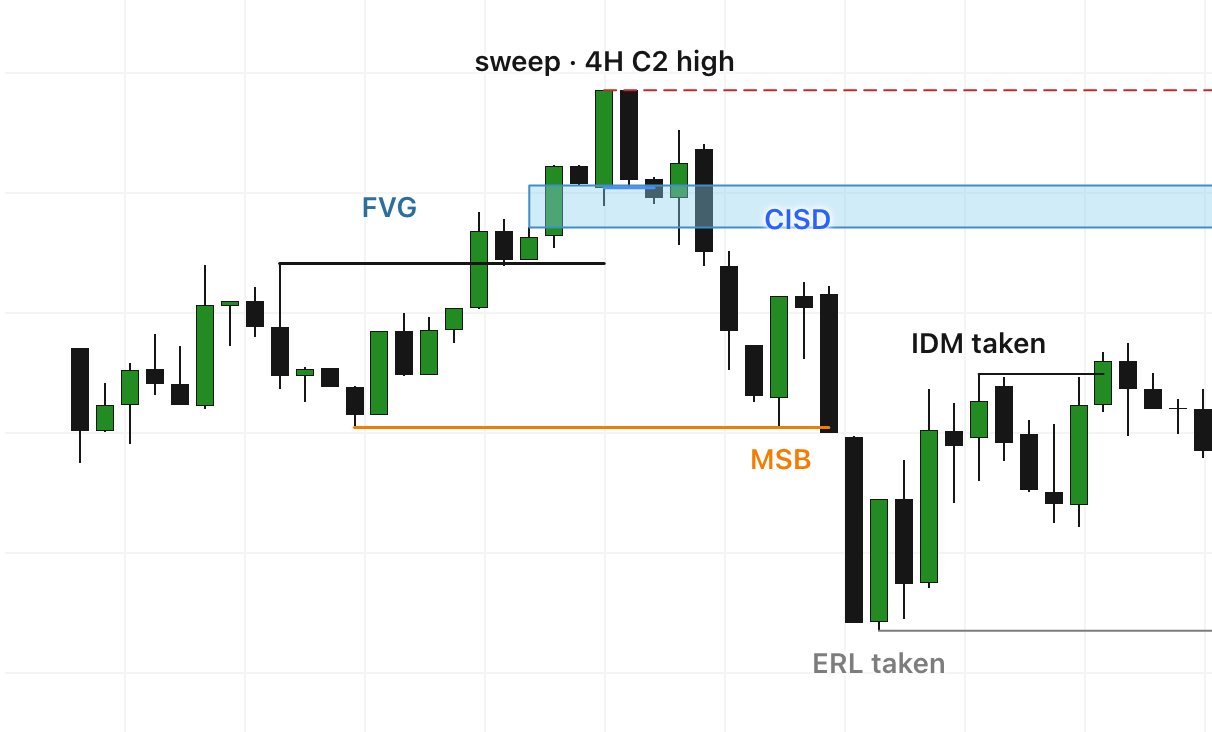
Close, not wick
A break is a close beyond the level, not a wick through it. Wicks through swing highs are how ranges work. If your structure read flips on a wick, it will flip back on the next one, and you will have been right in both directions within the hour.
It helps to name the state you are in. Trending: breaks keep coming in one direction. Tested: a counter-swing was taken on a wick, nothing has changed yet, and this is where most early reversal calls are made. Broken: a counter-swing was taken on a close, and the old read is no longer the working one. Unclear: overlapping swings and no clean break either way. ‘Unclear’ is a proper answer, not a failure to find one.
Structure also belongs to a timeframe. A swing on the 5-minute chart may not exist on the hourly chart at all. When you say structure is bullish, say on which timeframe, and mark the swings only from that timeframe's candles.
What structure can and cannot tell you
Structure describes what has happened. In our own tests, a close through a swing was not followed by continuation more often than a random candle in the same conditions, so a break is a description, not a forecast. The same goes for a trend's age: across 557,155 trend episodes, an old trend had as much life left in it as a young one.
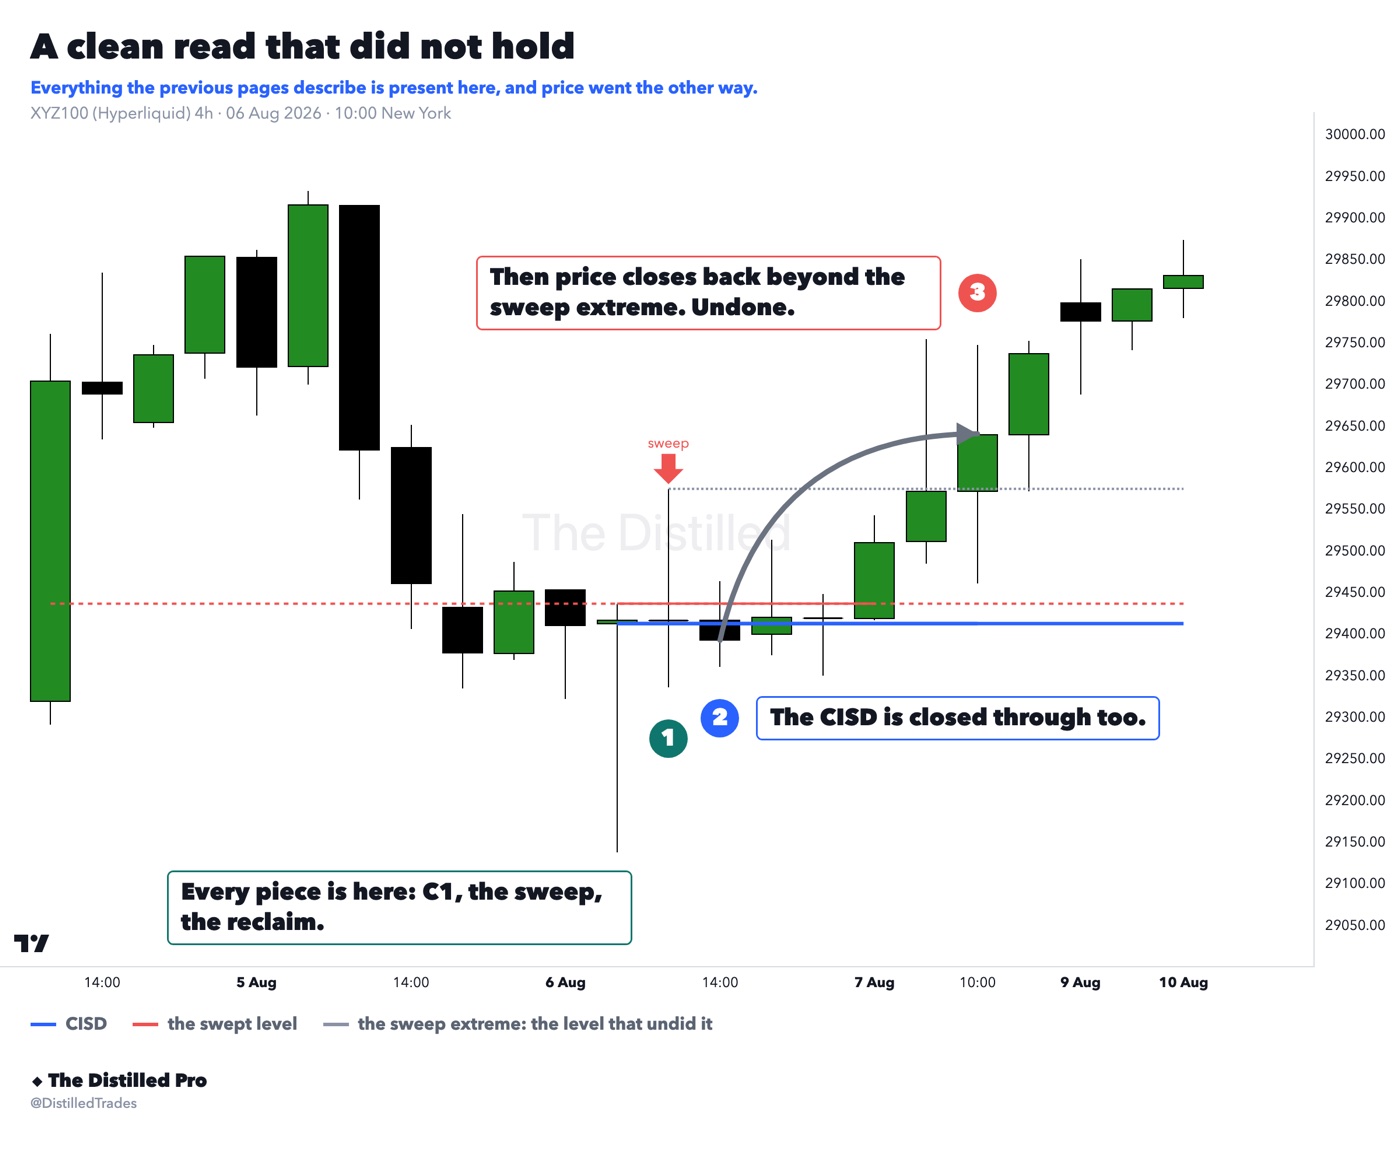
What structure does give you is a place to be wrong. Every read in this course comes with a level that would cancel it, and that level is almost always a swing: the sweep's extreme, the last low of the leg, the swing the MSB closed through. When price closes back beyond it, the chart has withdrawn the read, and you find out from the same chart that gave it to you. The second figure shows exactly that: every piece present, and then a close back above the sweep's high.
- A swing high has lower highs either side, and is only confirmed once those candles close.
- BOS is a close beyond a swing with the trend. MSB is a close through a swing against it.
- A break is a close, never a wick. Name the state: trending, tested, broken or unclear.
- Structure describes; it does not forecast. Its real use is the level that cancels your read.
Scroll back a few weeks and cover everything to the right of one candle. Step forward one candle at a time and mark each swing only once it is confirmed. Label every close through a swing as BOS or MSB, and circle every wick through a swing that did not close through it. Count how many of those wicks you would once have called a break.
Related on the site
Education only, not financial advice.