 The Distilled
SIRC in one chart
Sweep, Inducement, Retest, Continuation: the four stages in the order they print, what you do at each one, and the chart language used in the rest of the course.
The idea in one line
Don't buy the sweep. Wait for the retest. Most traders are taught to buy the sweep, or the first close through the CISD. Both usually happen in the middle of the move, with the stop far away. SIRC reads the same move in four steps and enters on the retest, where the risk is smaller and the idea is clearly wrong if the sweep's wick trades again.
SIRC puts together what Module A built: the sweep and the C2 from lesson 3, the break of structure from lesson 4, the gap from lesson 5 and the inducement from lesson 6. Nothing new is added. What SIRC adds is the order.
The four stages
S, the sweep. A level is taken and price closes back inside. The CISD confirms it: a close back through the open of the run that delivered the sweep. Then the MSB: a close through the last swing before the sweep. S is complete when all three have printed. What you do: mark the sweep's wick. That is your stop.
I, the inducement. After the break, price makes a new high and pulls back. The first higher low is the IDM (a lower high on a short). What you do: don't buy it. Wait for it to be taken.
R, the retest. Price trades back into the FVG the move left behind, beyond the IDM. What you do: enter on the close back out of the FVG. No close back out, no trade.
C, the continuation. What you do: target 2R, with the ERL, the high of the move, drawn as a level. It is often, though not always, on the way to the target. The stop stays beyond the sweep's wick. If it is hit first, the setup is over. No second entry.
Reading the example
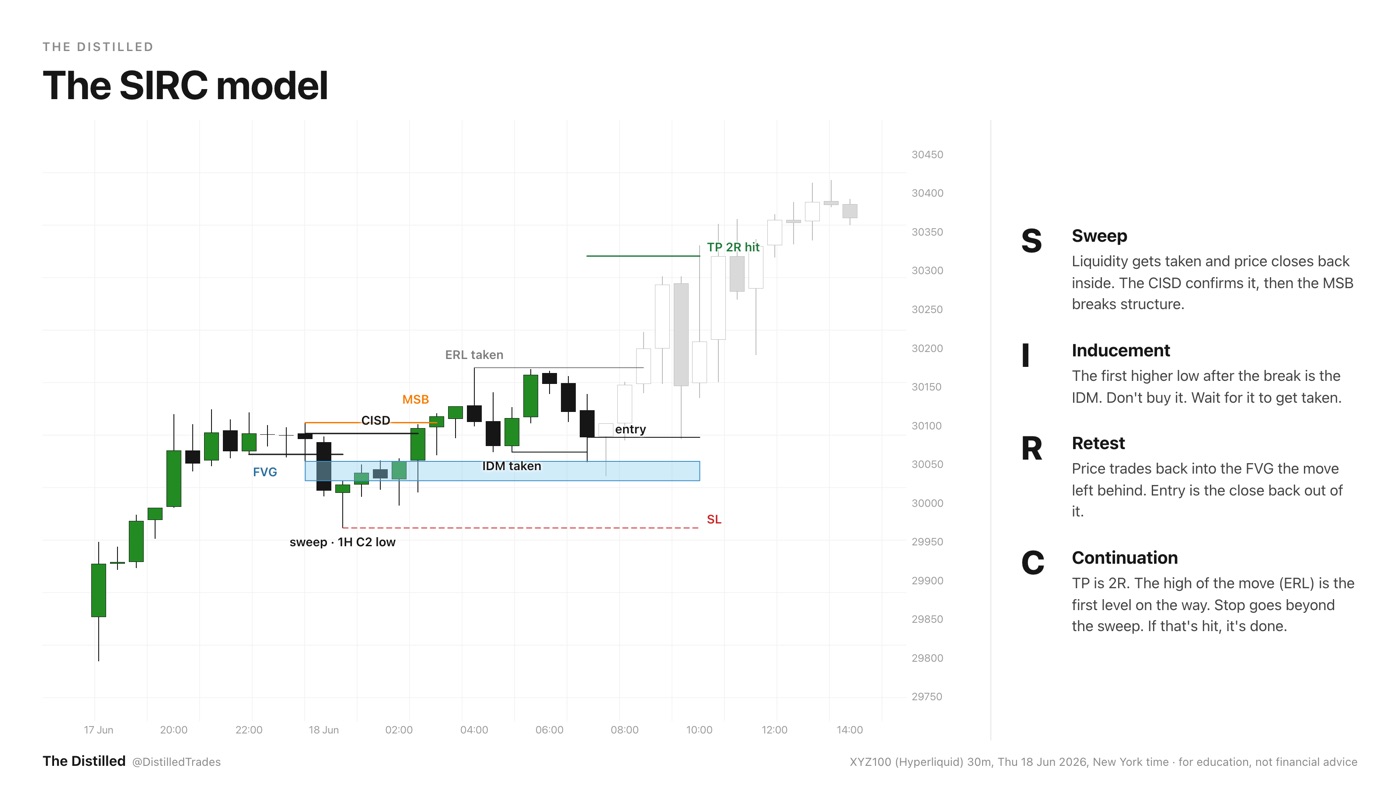
On the 18 June 2026 chart (XYZ100, 30-minute candles), price swept the 1-hour C2 low at 00:30 New York. The 02:30 candle closed back above the level and through the open of the run that had delivered the sweep, which is the CISD, and the 03:00 candle closed above the last swing high before the sweep: the MSB. S was complete.
Price ran on to 04:00, then pulled back. The first higher low, at 05:00, became the IDM, and the 07:00 candle took it, wicked into the FVG and closed back out: the entry. The stop sat beyond the sweep's wick, and the 2R target was hit on the 10:00 candle, New York time.
The chart language
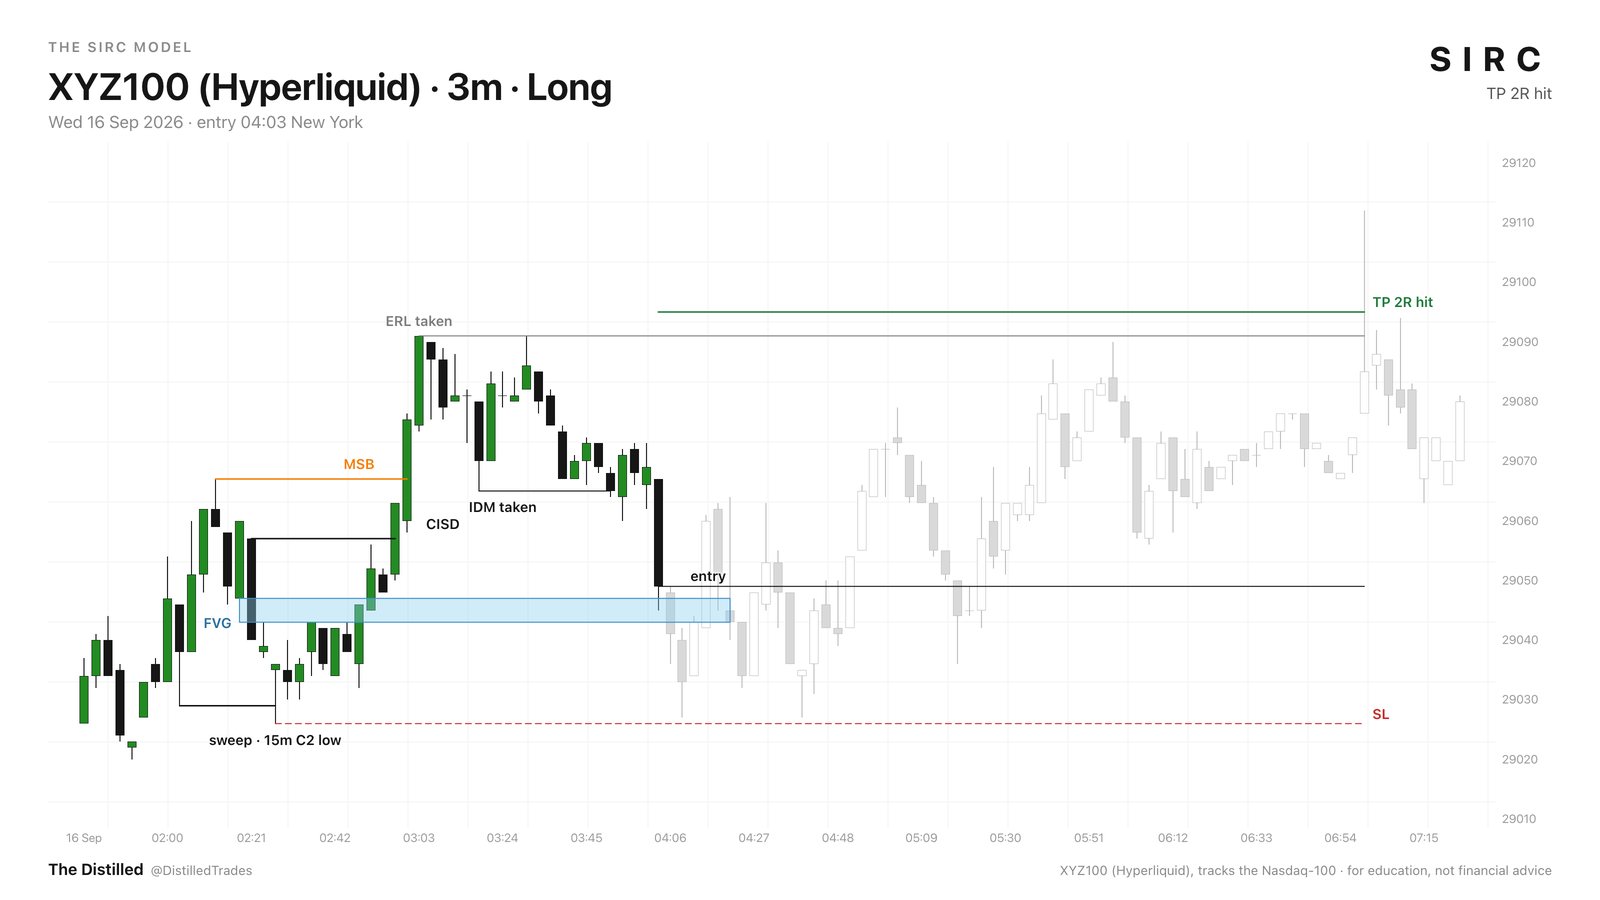
Every SIRC chart in this course uses the same conventions, so you can read one at a glance. Solid lines have confirmed; dashed lines are still pending. The IDM is dashed until it is taken, the FVG border is dashed until the retest, and the stop and target are dashed until one of them is hit.
The sweep and the CISD are black (the CISD is blue on some shorts), the MSB orange, the FVG baby blue, the stop red, the 2R target green and the ERL grey. Green candles closed up and black candles closed down. Grey candles came after the entry; they show what happened without being part of the read.
What SIRC is and is not
SIRC is a checklist: four things you can point at on a chart, in the same order every time. It is not a signal, and there is no win rate you should expect from it. All four stages can print and the trade can still lose. At a 2R target, a market with no edge hits the target about 1 time in 3, and that is the line to judge any set of SIRC trades against.
What it gives you is a defined read and a defined risk: a reason, a price where you are wrong and a target, all fixed before you click. Before every entry, ask four questions. Sweep, CISD and MSB all printed? IDM formed and taken? Price tapped the FVG and closed back out? Stop beyond the sweep's wick, target 2R, and the risk sized before the click? The next five lessons take each stage in turn, including a trade that did everything right and was stopped.
- S: sweep, CISD, MSB. Mark the sweep's wick; it is your stop.
- I: the first higher low after the break. Don't buy it. Wait for it to be taken.
- R: enter on the close back out of the FVG, not on the tap.
- C: stop beyond the sweep, target 2R, the ERL drawn as a level, no second entry.
- Solid means confirmed, dashed means pending. At 2R the chance line is 1 in 3.
Find five SIRC setups on your own chart from the last month, winners and losers. For each, mark the four stages in order, dashed until each one confirms. Where a setup stalls, write down the stage it stopped at.
Related on the site
Education only, not financial advice.