 The Distilled
I: the inducement taken
The second stage in practice: finding the IDM after the break, following it when it moves, and what it looks like when price takes it on the way into the gap.
After the break, wait
Once the S is complete, price usually keeps going for a while. On a long it makes a new high, then pulls back, and that pullback is where the I stage lives. The first higher low that forms after the break, having pulled back at least a quarter of the move from the sweep, is the IDM.
Mark it with a dashed line from the candle that made it. This is the obvious entry, and the point of marking it is to not take it. You are waiting for it to be taken.
How long that wait lasts varies. On the 18 June 2026 long, the IDM formed at 05:00 New York and was taken at 07:00. On the 31 August 2026 gold short, it formed at 11:00 and went at 12:15. On the 16 September 3-minute chart, it formed at 03:18 and went at 03:51. There is no set interval, so do not treat a slow IDM as a failed one.
Following the IDM
The IDM is not fixed at the first pullback for good. If price makes a newer high before the IDM is taken, the IDM moves to the next higher low. An old IDM that price has left behind stops mattering, because the people watching the chart are now watching the newest higher low.
If instead price breaks below the last low of the leg, the leg is failing and you stand aside. The difference is where the break happens. An IDM taken on the way down to the gap is the setup doing what it should. A close through the leg's low is the move you were reading coming apart.
On a short it is the mirror: the IDM is the first lower high after the break, a newer low moves it to the next lower high, and a close above the leg's last high means the leg is failing.
Keep watching the stop as well. If price trades back through the sweep's wick at any point before an entry, the setup is dead. No IDM, gap or entry can bring it back.
Taken on the way into the gap
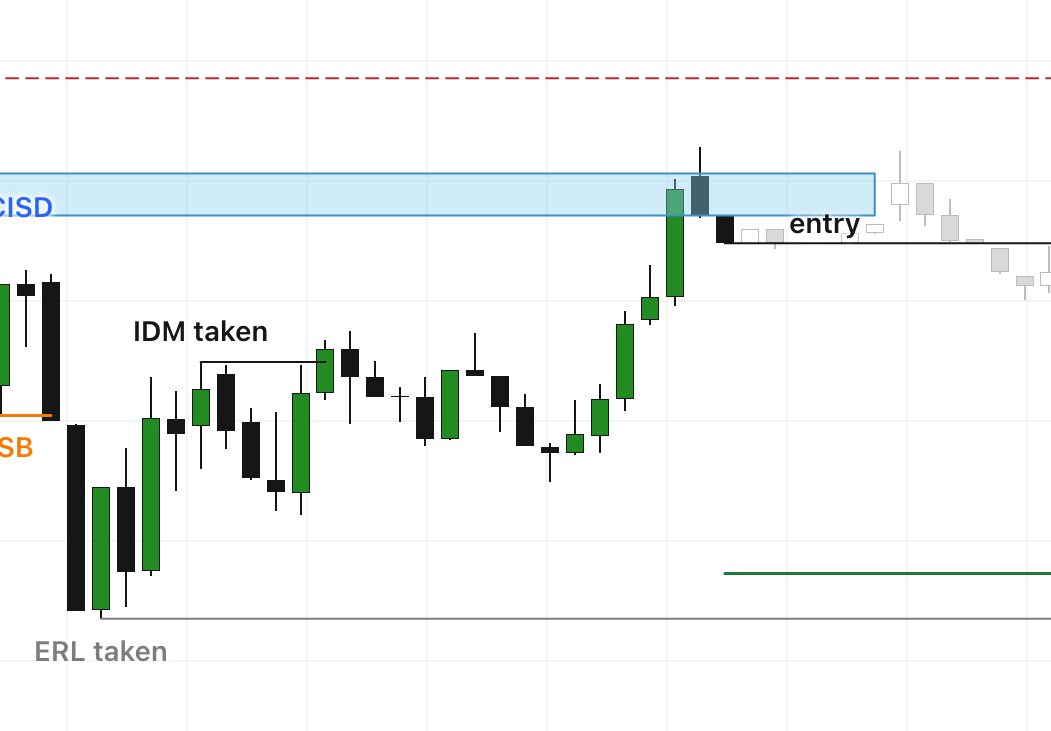
The IDM is taken when a wick trades through it. Often that happens on the same run that carries price into the FVG, which is the point of the whole stage: the stops beyond the obvious pullback get filled, and the move that fills them delivers price to the gap.
On the gold short from 31 August 2026, price fell from the sweep, printed the ERL at 10:00 New York, then climbed back through the afternoon. The IDM, a lower high from 11:00, was taken at 12:15; price dipped, climbed again and reached the FVG at 15:45. Price traded inside the gap for two candles, and the 16:15 candle closed back out below it: that close was the entry. On the 3-minute long from 16 September in lesson 8, the 03:51 candle took the IDM and the 04:03 candle wicked into the gap and closed back out of it.
Taken does not mean it will work
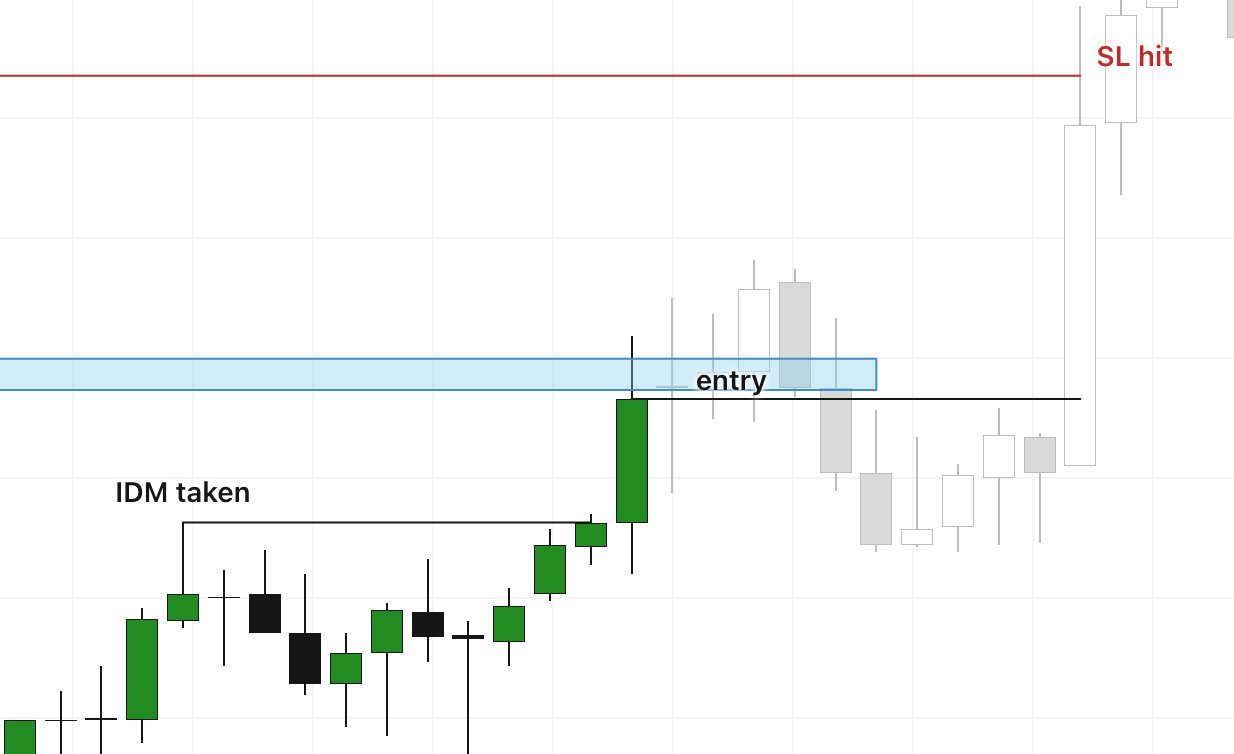
An IDM being taken is a condition, not a promise. The stopped short in the second figure took its IDM cleanly, retested the gap and gave a textbook entry at 09:30 New York. Then price went back through the sweep's high. Nothing about the I stage told you which of the two trades it would be.
What the I stage does is make the entry you eventually take a specific one: after the obvious buyers or sellers have been cleared out, inside the gap, with the stop still at the sweep. That is a smaller risk than buying the obvious pullback. It is not a better chance of reaching the target. At 2R, expect about 1 in 3, the chance line.
When the IDM goes, write down three prices: the IDM, the near edge of the gap and the sweep's wick. The distance from the near edge of the gap to the wick is roughly the risk you are about to take. If that is more than your budget allows at the smallest size, you know before the retest that you will pass.
- The IDM is the first higher low after the break that pulls back at least a quarter of the move.
- A newer high before it is taken moves the IDM to the next higher low.
- A close through the leg's low means the leg is failing. Stand aside.
- It is taken by a wick, often on the run that delivers price into the FVG.
- A taken IDM is a condition, not a promise. At 2R, about 1 in 3.
Take the five SIRC setups you marked in lesson 8. For each one, record where the IDM first formed, whether it moved before it was taken, and whether it was taken on the same run that reached the FVG. Add any setup where the IDM was never taken, and note what price did instead.
Related on the site
Education only, not financial advice.